Project Insights
The Insights tab on your project page provides an at-a-glance overview of your deployment activity. It helps you understand how often you deploy, how reliable your deployments are, and how each server is performing.
Accessing Insights
Navigate to your project and click Insights in the sidebar, between Build Pipeline and Settings.
Time Range
Use the dropdown in the top-right corner to select a time range:
- Last 30 days
- Last 90 days (default)
- Last 6 months
- Last 12 months
All metrics and comparisons are calculated based on the selected time range.
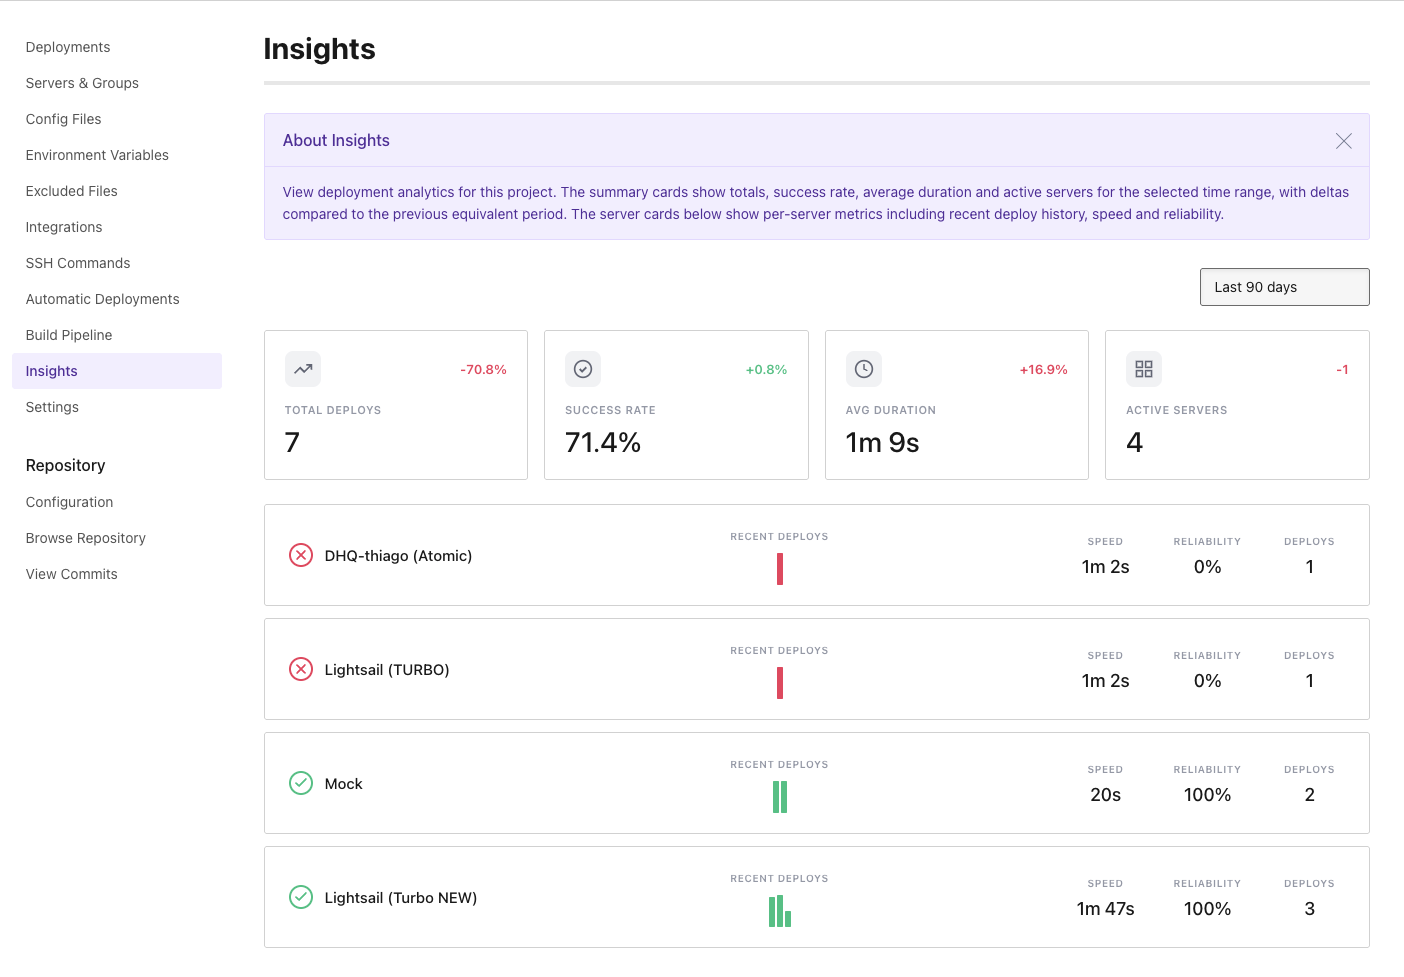
Summary Cards
At the top of the page, four summary cards show high-level metrics for the selected period:
- Total Deploys - The total number of deployments (excluding previews) in the selected period.
- Success Rate - The percentage of deployments that completed successfully out of all completed and failed deployments.
- Avg Duration - The average time taken for a deployment to complete, measured from start to finish.
- Active Servers - The number of distinct servers or server groups that received at least one deployment.
Each card shows a delta badge indicating the change compared to the previous equivalent period. For example, if you are viewing the last 90 days, the delta compares against the 90 days before that. A green value indicates improvement, while a red value indicates regression. For the Avg Duration card, a decrease (faster deploys) is shown in green.
Server Cards
Below the summary, each server or server group that received deployments in the selected period is shown as a card with:
- Status icon - Shows whether the most recent deployment to this server succeeded (green check) or failed (red cross).
- Recent Deploys - A mini bar chart showing the last 25 deployments. Bar height represents the deployment duration relative to the longest deploy, and colour indicates the result: green for success, red for failure. Hover over a bar to see the exact duration.
- Speed - The average deployment duration for this server.
- Reliability - The percentage of successful deployments out of all completed and failed deployments for this server.
- Deploys - The total number of deployments to this server in the selected period.
Tips
- If a server shows 0% reliability, check the recent deploys chart to see the pattern of failures.
- Use different time ranges to spot trends. A shorter range (30 days) highlights recent changes, while a longer range (12 months) shows overall trajectory.
- Servers or server groups with no deployments in the selected period are not shown.